Dashboard Walkthrough
Overview
The Oju Dashboard provides a comprehensive real-time monitoring interface with seven key components, some of which update automatically every 60 seconds. This walkthrough explains each section and how to effectively use the dashboard for security monitoring and incident response.
Dashboard Components
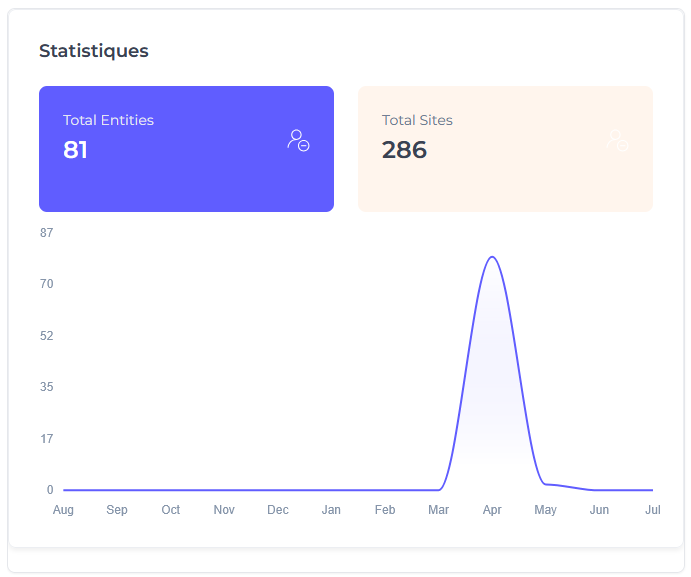
1. System Statistics
Purpose: Growth metrics for monitored entities and platforms
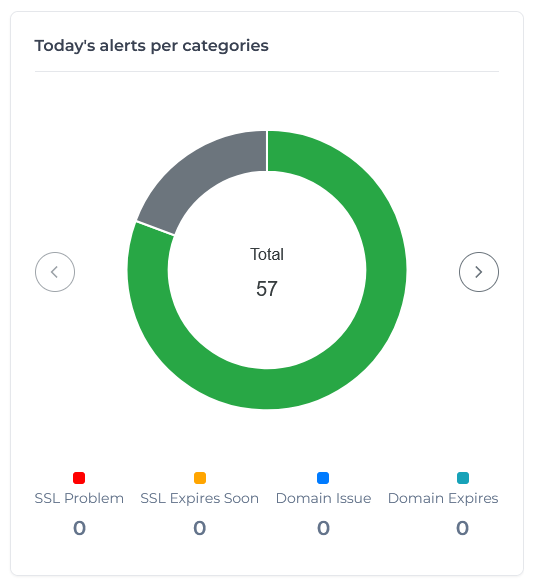
2. Today’s Alerts per Categories
Purpose: Current day alert distribution by security issues type
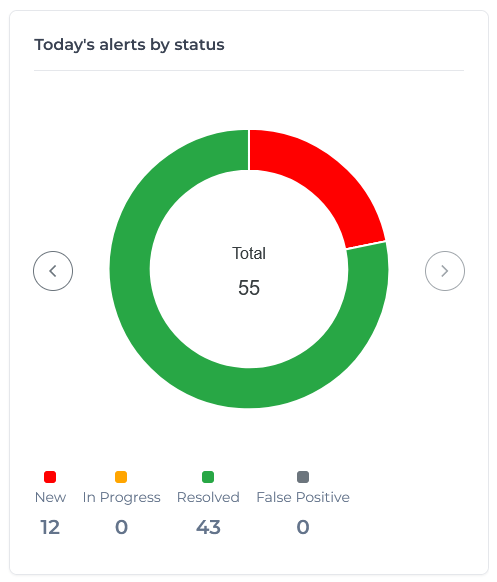
3. Today’s Alerts by Status
Purpose: Processing status of current day alerts
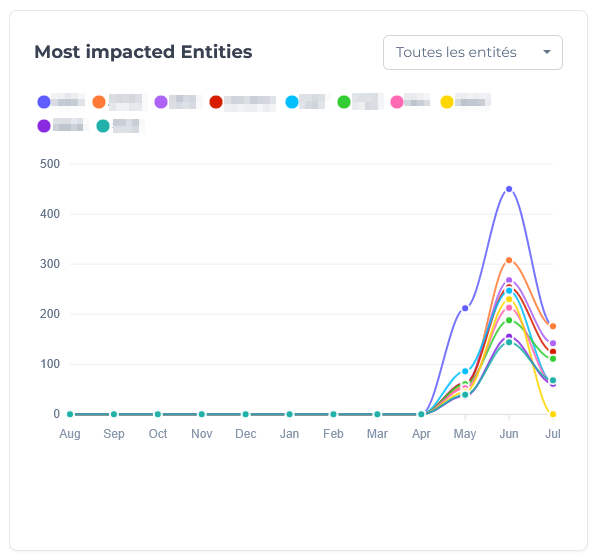
4. Most Impacted Entities
Purpose: Historical analysis of the 10 entities most affected by security issues over the past 12 months
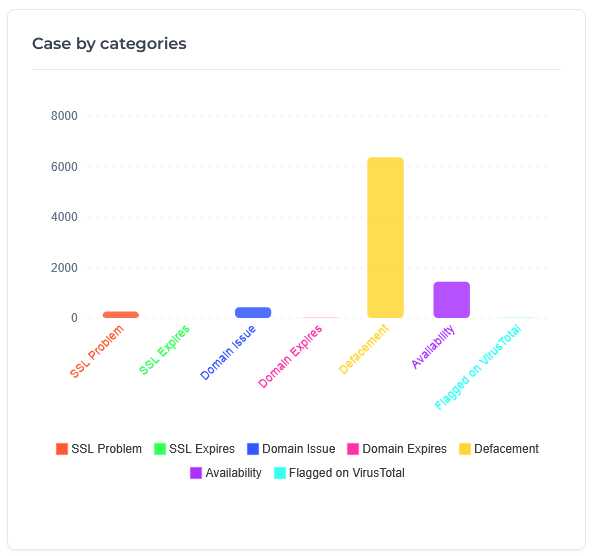
5. Cases by Categories (All Time)
Purpose: Historical alert volume analysis by categories
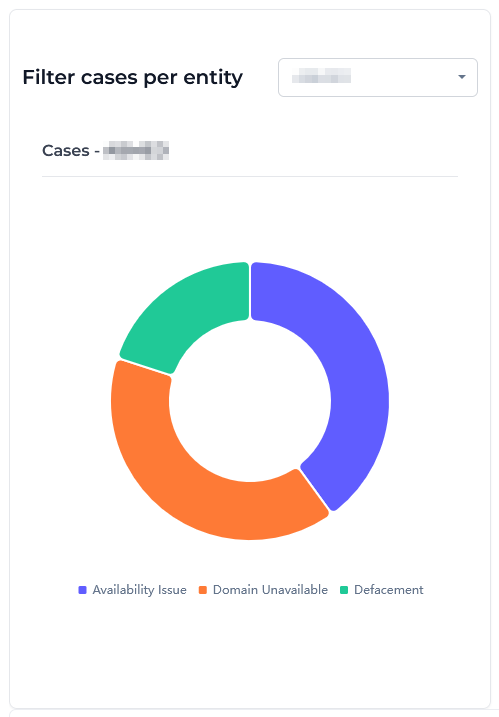
6. Entity-Specific Case Analysis
Purpose: Organization-focused analysis showing security issues breakdown by type
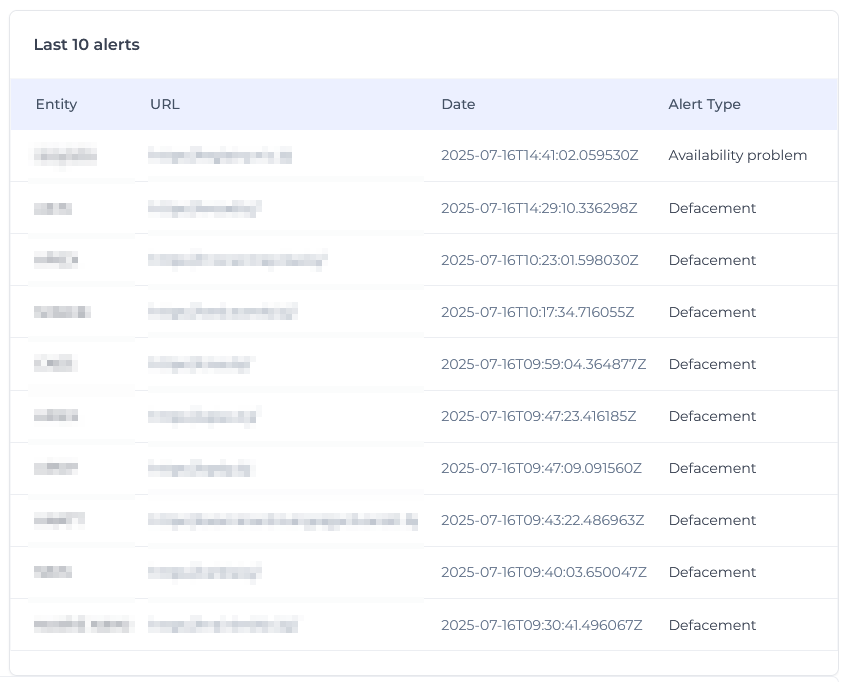
7. Recent Activity Feed
Purpose: Real-time incident tracking (Last 10 alerts)
The Dashboard Walkthrough provides the foundation for effective real-time security monitoring, enabling rapid incident detection, assessment, and coordinated response across your monitored organizations and platforms.